The little Ozobot speeds around the corner, flashing colorfully, winds its way along a spiral, collides briefly with one of its colleagues and finally finds its way through the maze. It is navigated to its destination by color sensors on its underside, which allow it to follow a defined route. The miniature robot was not programmed by a high-tech engineer, but by Magnus, 10 years old, and the son of our co-founder Simone Drill.
During a programming workshop, he learned to give commands to the Ozobot and to control it with the help of color codes. This was made possible by witelo e.V. from Jena, who offer working groups and experimentation courses at schools, as well as extracurricular learning formats. These scientific and technical learning venues were founded to promote so-called STEM education, with computer science as one of its components. Students learn the basics about coding, robotics and algorithms in research clubs, on hands-on days and during a wide range of vacation activities. In this context, Magnus also had the opportunity to playfully gain his first programming experience and took his enthusiasm from the workshop home with him.
Source: Ozobot
Word of Witelo’s work quickly spread among the Xceptance staff, and numerous children followed Magnus’ example. Here, the offspring are following in the footsteps of their parents, who are also involved in programming, software testing and development at Xceptance.
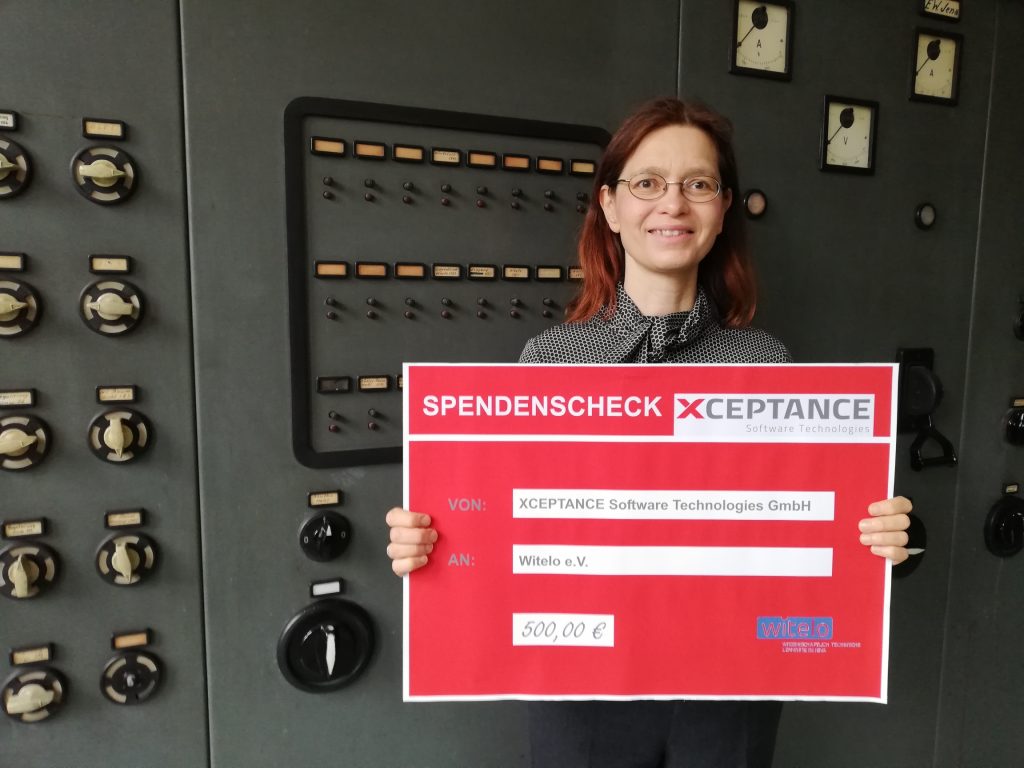
“It’s close to our hearts that our children remain curious and have the chance to test their skills, so we would like to contribute to the dedicated work of the association with a donation”, says Simone Drill. “We want to spark young people’s excitement for IT topics and help them to gain perspectives for their career choice.”
With more than 80 network partners from research institutions, companies, associations and initiatives, witelo has established itself excellently in Jena over the past ten years. In addition, there are schools from Jena and the surrounding area, as well as many private individuals who enrich the educational landscape with their commitment. This positive development encourages managing director Dr. Christina Walther in her work: “Students should learn how important an understanding of science and technology is in their everyday lives – but also what great job opportunities the STEM subjects offer.” That’s why she stays in close contact with the parents of her course participants and promotes partnerships with companies like Xceptance. This ensures that the valuable cooperation between schools, science, and business continues to enrich the technical education of young people and that fun and learning don’t exclude each other.
Managing Director Dr. Christina Walther at witelo headquarters
About witelo e.V.
Witelo is the network of science and technology learning sites in Jena. The goal of its work is to get children and young people excited about STEM subjects, i.e. mathematics, computer science, natural sciences and technology. A broad alliance of city, business, and institutions supports witelo – the work of the association is financed by supporters and sponsors. You can find further information on the numerous offers and activities on the witelo website.
TL;DR: Load and performance testing produces a vast amount of data. This data has to be interpreted and communicated. Because not every interested party speaks the same language, Xceptance developed a performance test rating and grading system. It evaluates response time, stability, and predictability and transforms three factors into a simple and communicable form. While doing that, it does not compromise on quality. It has been successfully used in more than 400 projects.
The Challenge
Load and performance testing is a key activity for making an online business successful. It validates that traffic and conversion expectations can be fulfilled. This of course applies to all kinds of Internet-based applications. Basically, as soon as there are expectations in terms of stability and performance, a test is mandatory to validate these. Expectations are usually set as requirements by different organizational groups such as sales, product management, engineering, and development teams.
Every group has a different understanding when it comes to results, goals, and success criteria. Some might be more concerned with the business impact, others are looking for technical implications of design decisions, and some just want to improve performance.
The group that is tasked with the evaluation of the requirements is faced with a very wide range of success definitions. In addition, it has to explain its technical measurements to all participating parties so that each party easily understands the state of testing.
Engineers rather look for detailed metrics including but not limited to the system behavior under test, while business-centric stakeholders just expect a clear yes or no. But performance testing typically does not deliver a clear result.
How can one reach all target groups without causing too much extra work to cater to all individual needs?
The Rating System
Xceptance developed a rating system that uses an American education system-like grading from A to F. The grades A to C symbolize a pass, while D and F are considered a fail. A grade B stands for an assumed average across similar customers and projects. It also stands for a good result. This leaves room in both directions to over or underperform.
Because performance results are not just shaped by response times, three factors are taken into account:
Response Times
Errors
Predictability
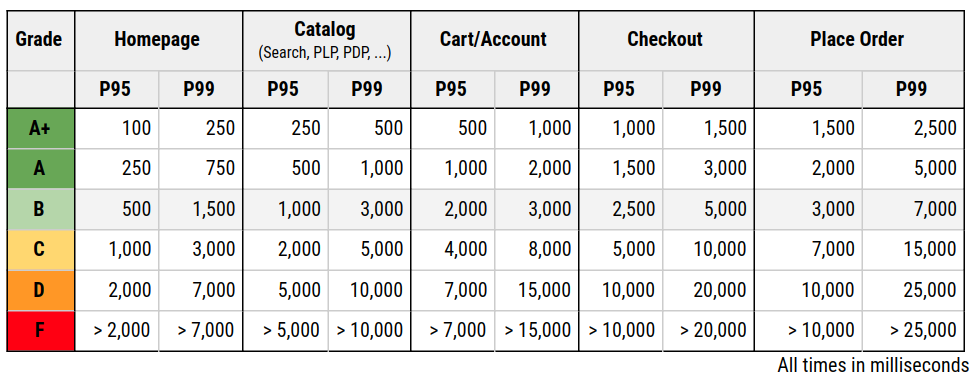
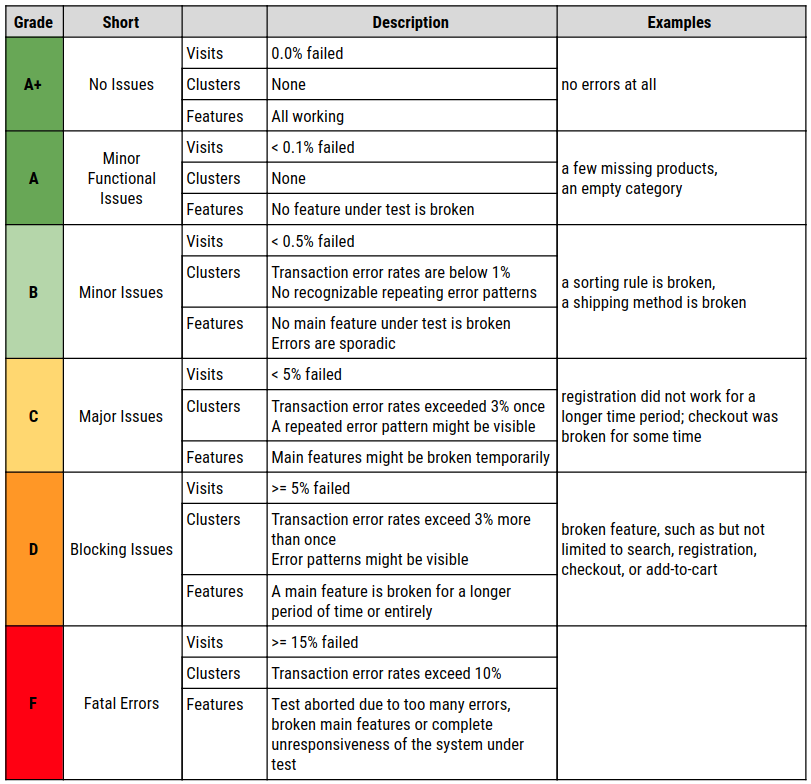
Before continuing a detailed discussion of the factors, this table explains each grade in one sentence. For the more ambitious customers, the A+ stretch goal was added.
Let’s talk about our three factors in detail now.
Response Times
To clarify one thing first, this is about server-side performance. It does not take the client-side rendering including the loading of any content or JavaScript execution into account. For this, Google Web Vitals provide an excellent scoring system. In addition, when you evaluate API performance, you might want to refine your performance expectations.
A response time typically defines the time from initiating a request to a server until the full response has been returned to the requestor. It is likely the most used number to describe performance.
Server response times are validated using percentiles. This number indicates what response time a certain amount of users experience at maximum. For the response time grading, the P95 value is used. That means that 95% of requests have been finished within that time or faster.
One of the reasons for going with the P95 is that the user of provided infrastructure and software has often only limited influence on the behavior of the full stack. Hence there will be peaks and outliers which cannot be controlled nor diagnosed.
One can use the average, but it is a very imprecise number. It will either move too much or too little in regard to outliers. It just does not show what most of the users will truly see. An average user will never post something negative on social media, but the last 15% of the response time range will. So the rating cares more about the negative impression than the positive. This sadly ignores the last 5% and that is where projects become expensive. It is really hard to convince all stakeholders to use the P95 instead of the average, trying to establish the P99 or higher is nearly impossible.
The response times are grouped by activities because the user usually is more impatient at the beginning of its user journey. This data is based on years of measurements and ensures that goals are achievable but also ambitious enough. They all might heavily vary on your platform and stack. So these are not set in stone and these examples might only work for commerce.
Errors
The fastest response times are of no help if the response is incorrect. So correctness is key to performance testing. One might just say, every response code larger than 400 is a failure, but it is not that easy. Hence this factor distinguishes between two different types of errors: technical and functional errors.
Examples of functional errors are, not fully set up products, products that cannot be bought together, or an empty search result. If a response was not received or the response code indicates a problem, it is considered a technical error. Or in other words: If the user is properly notified about the problem, it is mostly a functional issue. If the state or messaging is undefined, it is mostly technical in origin.
A performance test has to ensure that technical errors are clearly highlighted because they might be caused by performance testing due to volume or scaling. Additionally, a performance test has to ensure functional correctness, because if the order cannot be placed and this is measured without validating the result, the test is just void.
To assign a grade to the error factor, this is verified:
How many percent of the visits have been affected by an error?
Do the errors occur in patterns or clusters?
Are there any main features affected such as checkout or sign in?
Since barely any test run is error free when reaching a certain complexity, a low error rate might still be acceptable, even for an A rating.
The disadvantage of this approach is that errors become an accepted fact.
Predictability
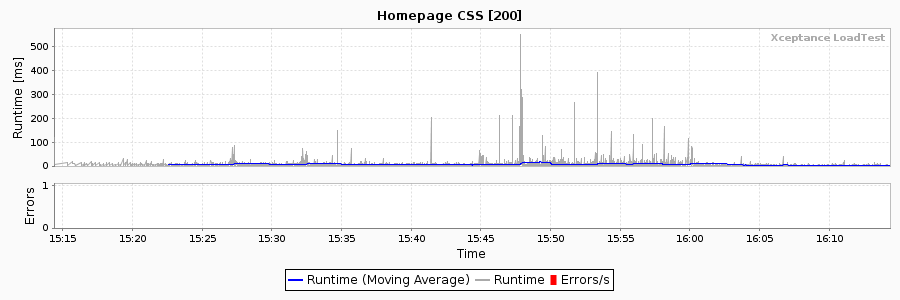
In a perfect world, response times would be the same all day long. But that is impossible to achieve in a complex IT landscape, hence it is essential to minimize the noise. That is what this rating tries to capture. It introduces a predictability grade. Because the evaluation of noise is a complex process, Xceptance decided to retract to a metric anyone can grasp.
Predictability is defined by the business impact on the end user. It uses response times exceeding a certain value and the occurrence of technical errors (mainly non-recoverable errors such as response codes 500 or no response at all). This should give the merchant an idea of how many visits might have been affected by problems or slowness. Furthermore, being affected means that a visit carries the risk of a loss in revenue or reputation.
The threshold of 10 seconds is based on the user perception model published in the Google RAIL Model. This model applies to the total page loading time. The factor predictability uses the 10-second threshold for the runtime of a request. This makes it even softer than the value Google suggests, because the additional loading time of images, CSS, JavaScript is ignored.
Apart from the affected visits, this factor also considers response time patterns, increasing response time over time, and any sudden runtime changes.
To determine the grade these two questions are asked:
How many visits are affected (see formula above)?
Are there any patterns in response times such as increases, waves, or repeating spikes?
Summary
This rating system provides comparable and understandable results and caters to the needs of many stakeholders. Xceptance rolled it out to almost all load and performance tests and it proves to be effective and reliable. Some customers even arrive now with a goal of a certain rating to improve on the previous year’s results.
Xceptance has put that performance rating guide under the Creative Commons license – CC BY-SA 4.0. Feel free to use it for your everyday work, improve on it, and please let us know any feedback. We certainly appreciate it.
After a two-year break, on 18 May 2022, the 4th Data Science Day Jena took place. The Friedrich-Schiller University is hosting this mini-conference format annually.
Xceptance presented this year a closer look at the data that is collected and processed during load and performance testing. René Schwietzke, Managing Director of Xceptance, talked about the challenges to capture the right data as well as translate the collected data into meaningful results.
A load test simulates millions of user interactions with a website and therefore is capturing huge amounts of data points. These have to be transformed into a few numbers to make the result of the test easy to communicate but still preserve important details. The talk started with typical business requirements and expectations of the target groups of a load test. It showed the data XLT captures and the dimensions which later drive the data reduction. A few example data series demonstrated the challenges behind the data reduction and what numbers are finally used to satisfy the requirements.
An example load test result illustrated the talk with real data. That example test run created about 17,500 data rows per second which contain about 293,000 data points. The entire test result consists of 3.2 billion data points. This massive data set is turned into a consumable report by XLT in less than six minutes.
For everyone with an interest in data science, this presentation also offers ideas for research in regard to unsolved data challenges. There might be even some Master’s and Bachelor’s theses topics waiting for you.
You can find a recording of the presentation below (courtesy of Thüringer Universitäts- und Landesbibliothek Jena).
This is the accompanying slide deck. It is a Reveal.js-based. You can navigate with the spacebar and the arrow keys.
After our presentation at the JUG Saxony Day in 2019, we have been asked to turn the talk into an article for the iJUG-Magazin Java aktuell. The February 2020 issue just got published and features this article. So get yourself the latest Java Aktuell or, if you just want to check out the article, use this link to the PDF and enjoy. The article is in German.
The days where Java was considered a slow bytecode interpreter have ended a long time ago. JVM is using many tricks in order to execute a code efficiently and to transform and optimize a Java code on the used hardware. With some knowledge about these processes, you can avoid working against the JVM system, while achieving more speed. Even if you are not chasing every last microsecond, it is still interesting to see what methods and techniques JVM uses for a better understanding of the runtime environment.
Because we encountered another hidden encoding issue as part of test data, here are some information about BOM and why this might be interesting in general for everyone working with a computer beyond Excel and Word.
Before you educate yourself, here is the tool to own to see such a problem easily. Most of all editors hide that information and so you might scratch your head why some data is failing with strange error messages. Get xxd and you will see with other eyes:
Wolfgang Tiefensee, Thuringia’s Secretary of Commerce, in conjunction with the board of directors of the IT industry network ITNet Thuringia, awarded the first Thueringen Open-Source Prize to three companies, all of them software companies based in Jena: TRITUM, Xceptance and GraphDefined.
It is an honor for Xceptance to be the second-place winner of this competition. This result clearly demonstrates that open source as a component of commercial products can be a clear competitive advantage. XLT incorporates a number of open-source projects, including Apache HttpClient, Jetty, HtmlUnit, JUnit, and the Apache Commons libraries. As part of developing XLT, Xceptance is involved in testing and providing feedback for these projects, thus giving back to the open-source community.
TL;DR: The perceived loading time is what shapes the user’s impression of the speed of a website, but measuring perceived loading time is difficult. There are technical loading times available but it is not clear if these times can be used in any meaningful way. This master’s thesis verified whether the perceived loading time can be easily correlated with any technical loading time, such as FirstPaint for instance. The result shows that a page with a fast loading time from a technical point of view is not necessarily perceived as fast by the user and vice versa. Therefore it is not sufficient to rely only on technical measurements and disregard the user’s perception.
Client-side performance is a big deal. There are various studies on the relationship between loading time and critical success factors such as usability of online shops, customer loyalty and sales. Yet a page with an objectively long total loading time could still be perceived as fast by the user, as the visible part of the browser window has already loaded and invites the shopper to interact with the page.
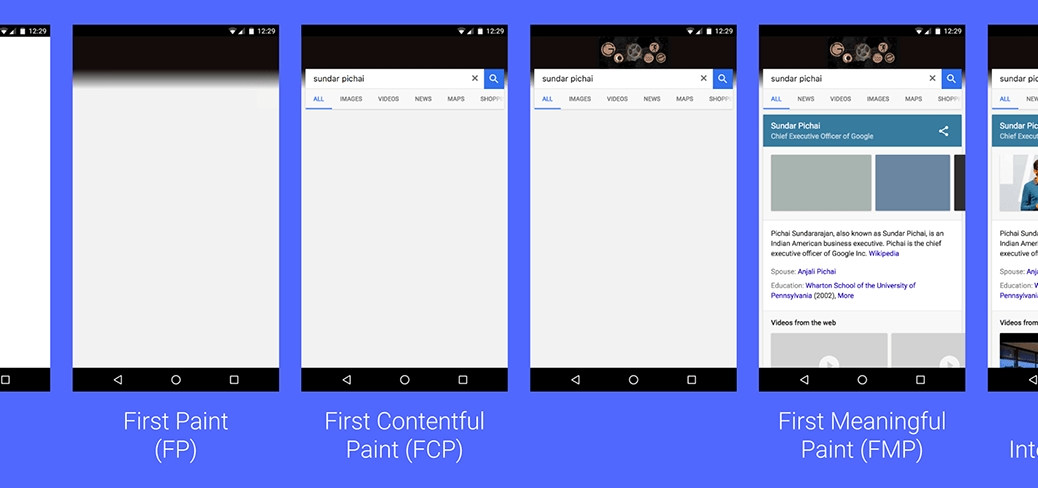
In her master’s thesis “Client-side performance: Comparison of measured and perceived loading times of online platforms in the B2C sector” Bastienne Sauter scientifically evaluated this discrepancy between the technically measured and the perceived loading times. By implementing automated tests with the automation tool XLT (Xceptance LoadTest), the loading times (timestamps recorded: domLoading, firstPaint, domInteractive, domContentLoadedEventStart, domContentLoadedEventEnd, domComplete, loadEventStart and loadEventEnd) of fifteen German e-commerce stores were measured over a longer period of time, both for desktop and mobile. For each store and timestamp, a ranking of the average loading times was calculated for each device.
In order to determine the empirical values for the perceived loading time, an interaction study with test groups of students and of Xceptance employees was conducted. Each group consisted of 25 persons, so a total of 50 people took part in the study. The participants had to open predefined pages of an online store and assess the loading impression. The user’s perception was evaluated using suitable scales. In this manner a score value was determined for each store among the two test groups. Each participant evaluated only three of the 15 stores in order to keep the effort manageable. In other words a store was covered by five test persons of each group (according to Nielsen and Landauer, a total of five respondents per store is sufficient for usability tests to be meaningful and to cover the majority of usability results). To ensure comparability of the results, the interaction study was conducted on the same devices and at the same location to avoid different bandwidths of the internet connection. Furthermore the test session for every person was set up in a way to avoid stress and create a normal daily usage situation.
Comparing the measured technical loading times with the perceived ones from the study, it showed that they differ clearly from each other, with no significant correlation.
To get an impression of which timestamp could be most relevant for the perceived loading time, the distances of the positions in the rankings were calculated. The smallest deviations for the desktop showed the timestamp domContentLoadedEventEnd, while the timestamp firstPaint could be most relevant for mobile devices.
Sum of the distances between the different positions in the rankings
As a conclusion, it is neither sufficient nor purposeful to consider only the technical measurements for the evaluation of the client-side performance, because the user’s perception deviates significantly from the technical measurement. This proved to be true both for informed insiders (represented by company employees) and also the uninformed public (represented by the students).
The results raise further research questions, especially how quality key figures for the perceived loading time can be recorded and contribute to the evaluation of online stores. In the literature, user-centered key figures such as FirstMeaningfulPaint are cited for this purpose. Whether these figures are in fact useful to represent the perceived loading time, however, is unclear and requires further investigation.
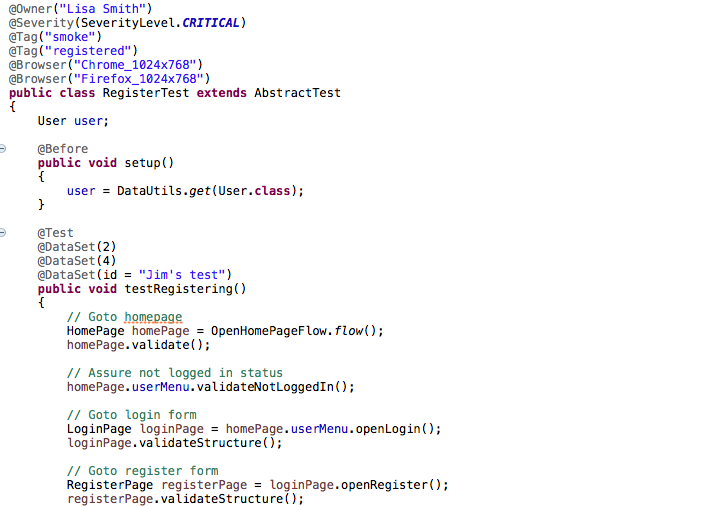
TL;DR: Neodymium is a Java-based test library for web automation that utilizes existing libraries (Selenide, WebDriver, Allure, JUnit, Maven) and concepts (localization, test multiplication, page objects) and adds missing components such as test data handling, starter templates, multi-device handling, and other small but useful everyday helpers.
Motivation
As a company focused on quality assurance and testing, Xceptance always needs test automation software, especially end-to-end automation software. Several years ago we built a Firefox add-on that was designed to create and run browser automation. The tool was primarily used by people who didn’t necessarily have a strong background in software development. Today, the landscape is a bit different: Mozilla cut the cord on the APIs we were using and standard programming languages have largely taken over test automation because they are more flexible and less proprietary. These changes convinced us it was time to implement an idea we had already hatched, namely our own Open Source test automation project: Neodymium. It is written in and utilizes the Java platform, it is MIT licensed, and of course you will find it on GitHub: https://github.com/Xceptance/neodymium-library
Basis
There are many libraries out there to aid web automation in Java, so developers are faced with the task of choosing ones they like and somehow making them work together. On top of that, there are tasks that require some custom code to work properly. We identified the overall tooling problem mostly as a hurdle in getting started and setting up a project. Finally, there are always things missing such as test data handling, concurrency, and common patterns which you don’t want to have to develop yourself. We chose JUnit, Selenide, WebDriver, Maven, and Allure for the base tooling.
Selenide provides an easy-to-use API to control Selenium WebDriver. Allure offers good mechanics to generate useful reports based on the assertions and actions you perform throughout your test cases. Maven is used to set up the build and execution environment for our framework and all the test projects. We decided to use JUnit as the test runner since it is the de facto standard in the Java world, but we enhanced the capabilities of JUnit to do even more. At its heart, Neodymium is a JUnit runner that wraps default JUnit behavior and adds significant useful functionality to it.
Multiple Browsers
You want to be able to run the same tests for different resolutions and/or browsers to simulate the browsers most common among your users. Additionally, you need to be able to implement small differences within your test execution to address variants such as responsive designs or progressive web apps. So we added a way to run web browsers with different configurations and retrieve the current device type and resolution from within the test.
Neodymium provides a Java annotation that can be added to your test case, in order to run different browser setups. Neodymium is very flexible in configuring browsers, allowing you to fully leverage the Chrome device emulation offerings.
Test Data
Another common task is the execution of a test case with different data sets, such as testing address forms with all the relevant variations. The basic idea is to have test data and data sets in structured files next to your code, preferably as JSON, XML, property style, or simply CSV. Hence, we introduced an easy-to-use API to access the current data set and retrieve basic types from it. Furthermore, you can configure specific scenarios running only a subset or even no data set at all by adding proper annotations. To complete the picture, Neodymium supports test data on a global and package-level scope.
Localization
Another recurring topic in modern software projects is localization. Most of the web sites that are in need of test automation also support several locales. We decided to provide an out-of-the-box solution.
Neodymium’s localization feature makes use of a central translation file written in YAML format. YAML helps to structure the translations. Additionally, we implemented a simple way to override specific translations for different locales. The localized text can be easily retrieved using Neodymium API methods that are globally available.
Development Support
As it is essential to understand what your test is doing, we added a feature that enables you to slow down the test execution and highlight elements that match the current selector. Since you can chain selectors using Selenide, any chain of elements is also represented by the highlighting. With this feature activated, a developer can track down the cause of test failures much more easily. In addition, we provide information on how to set up logging in your project should you need that. Finally, we decided to use the Page Object pattern to organize the website-related code to reduce the maintenance effort and increase reusability.
Reporting
Allure is a widely used framework to generate reports. When using Neodymium with Selenide, your automation code also contributes report information. Your test classes and methods are listed as well as detailed Selenide automation commands. In case of errors, additional details such as screenshots and source code of the page in question are available. Neodymium also provides means to structure code blocks for reporting purposes.
Continuous Integration
Implementing principles of continuous integration will deliver more reliable software by increasing efficiency, and automation is nothing without a continuous integration environment. Yet in almost every development cycle you will eventually end up needing varied settings due to differences in your setup, which can get complicated. Neodymium provides support for extra configuration files during development to override the standard production settings as needed. Furthermore, the framework supports overriding properties that change the configuration of your test execution by setting environment variables or simply passing Java arguments.
Because automation is supposed to run quickly, Neodymium provides support for parallel test execution and also demonstrates that setup as part of the sample test suite.
Documentation and Templates
Does Neodymium address some of your test automation challenges? Does it sound like a good entry point for your test automation?
We are Xceptance. A software testing company with strong commerce knowledge and projects with customers from all around the world. Besides Neodymium, we have developed Xceptance Load Test (XLT), a load and performance test tool that is available free of charge and features an extensive range of awesome features to make the tester’s and developer’s life easier.
If you are looking for test automation that also covers the performance side of life, take a look at XLT. You can write and run load tests with real browsers including access to data from the Web Performance Timing API. In case browsers are too heavy, XLT has other modes of load testing to offer as well.
We offer professional support for Neodymium as well as implementation and training services.
Xceptance released version 4.12.2 of its load testing and test automation product Xceptance LoadTest. This is an improvement release. We recommend upgrading to this newest version.
Test Framework
Improvement: The result browser features a new tab that displays JSON responses in a tree-like view. The data can also be searched and filtered.
Improvement: The existing automatic request retry mechanism has been enhanced to retry failed requests in additional error situations such as connection resets. This should now behave similar to real browsers.
Improvement: When failed requests are retried, an event with diagnostic information is logged for each retry.
Improvement: The bundled Jetty library has been updated to the latest available version 9.4.14.
Load Testing
Improvement: Our public AWS machine images now come with OpenJDK 11.
As always, this upgrade is free and don’t forget, XLT itself is free as well. You don’t have an excuse to skip performance testing or rely on lame simple test cases anymore.
We use cookies. For more information please read our privacy section. We also use analytics.
By clicking Opt-Out, we will place a non-personalized cookie on your machine that indicates that you don‘t wish to be tracked.